Scoring Detectors and Trackers
Summary
This document corresponds to the scoring and evaluation example folder within a VIAME desktop installation. Contained in this folder are a few options for scoring either detections, frame-level classifications, or object tracks.
The scripts take a computed detections file and a ground truth file, both in VIAME CSV format. Two example files are provided:
detections.csv– computed detections with confidence scoresgroundtruth.csv– ground truth annotations
Every script calls the viame score tool, which computes detection, MOT, HOTA and KWANT-style metrics together in one pass. The metrics are implemented directly in C++ against VIAME CSV, with no external scoring dependency: earlier releases shelled out to KWANT and wrapped kwcoco and motmetrics, and those paths are gone. The scripts differ only in which outputs they ask for.
For each script, there are two operating modes: a normal (“across all”) option and a per-class option. The normal method will score the outputs of all categories jointly together, typically producing a results figure or table showing all object classes. In most of these cases the default is to treat the class with the highest confidence in a detection as its respective label, and ignore any classes with lesser scores. In the per-class usage, this will not be the case, and the confidence score for each category will be considered regardless of other categories, and a plot/chart for a single category will be generated (for each category).
Common options accepted by all scripts:
--iou(default: 0.5) – IoU threshold for matching detections to ground truth.--conf(default: 0.0) – Minimum confidence threshold for computed detections.--per-class– Report each category independently as well as in aggregate.--no-tracking– Skip the track metrics and score detections only.--output-summary– Write the printed summary to a file.--output-metrics– Write every metric as JSON, including the confusion matrix (class names, raw and row-normalised counts, per-class accuracy).--json-curves– Also inline the full PR and ROC curve points in that JSON. Off by default: the curves carry one point per detection, so a large run would inline millions.--labels– Class synonym file, so a model and its groundtruth may use different vocabularies. One class per line:canonical: alias1, alias2.--list– Text file of frame identifiers; only those frames are scored, on both sides.--input-format–viame_csv(default) or any kwiver reader: coco, cvat, dive, habcam, yolo.--track-detections– In a folder holding both*_detections.csvand*_tracks.csv, score the track files instead.--top-class– Consider only each detection’s highest scoring class. By default a detection naming several classes is offered to each of them.--aux-confidence– Rank on the detection confidence column rather than the per-class score.--defaultlabel– Class name for detections carrying none.--sweep-thresholds/--sweep-interval– Score across a range of confidence thresholds and report, per class, the threshold maximising IDF1 and the one maximising MOTA.--filter-estimator/--output-sweep– Turn those swept thresholds into a DIVE confidence filter (none,min,avg,avg_minus_1p,idf1,mota), written withclass_metrics.csvinto the sweep directory.--match-mode–box(default) overlaps bounding boxes;polygonoverlaps the(poly)outlines wherever both sides carry one, falling back to the box for any pair that does not. Every metric downstream of matching, AP included, follows the choice, so this is how segmentations are scored. In either mode the mean and median polygon IoU of matched pairs with outlines on both sides are reported (mean_polygon_iou).--keypoint-threshold(default: 0.1) – Head and tail keypoints are compared wherever both sides carry them: mean pixel error per point and PCK, the fraction within this fraction of the groundtruth length (its head-to-tail distance, else its length column, else its box diagonal). Lengths are compared too, from the length column or else the head-to-tail distance: MAE, MAPE, RMSE and signed bias (length_*).--output-matches– Write every object’s tp/fp/fn assignment at the configured threshold as JSON, keyed by the ids and frame numbers of the input files, so a viewer can highlight misses and false alarms.--output-plots– Render PRC, ROC, confusion matrix and score histograms.--output-pr-csv/--output-roc-csv/--output-conf-csv– Write the underlying curve and matrix data as CSV, so it can be replotted or diffed without rescoring.
With --sweep-thresholds the metrics JSON also carries a sweep section holding, per class and for the aggregate, every swept threshold with the precision, recall, F1, MOTA, MOTP, IDF1, HOTA and count metrics at each one, and sweep_curves.csv is written beside class_metrics.csv. DIVE’s scoring panel plots these to pick an operating point; the aggregate curve never feeds the written DIVE filter.
PRC and Confusion Matrices
Scripts:
detection_prcs_and_conf_mat_across_all– All categories scored jointly.detection_prcs_and_conf_mat_per_category– Each category scored independently.
These scripts produce Precision-Recall Curves (PRC), confusion matrices, and a summary metrics table. Input can be in any format VIAME supports (e.g. VIAME CSV).
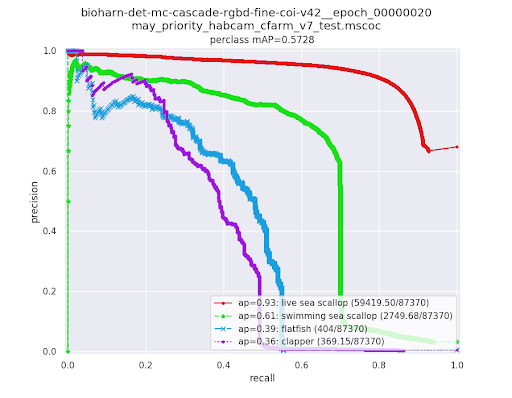
Precision-Recall Curve (PRC): Shows the trade-off between precision and recall as the confidence threshold varies. Each point on the curve represents the precision and recall achieved at a particular confidence threshold. One curve is generated per class. A detector with perfect performance would have a curve that stays at precision=1.0 across all recall values. The area under each curve is the Average Precision (AP) for that class.
- Precision = TP / (TP + FP) – Of the detections the model produced, how many were correct.
- Recall = TP / (TP + FN) – Of the ground truth objects, how many did the model find.
- Average Precision (AP) – Area under the precision-recall curve for a single class, summarizing performance across all confidence thresholds.
- Mean AP (mAP) – The mean of AP values across all classes. Reported in the plot title (e.g.
perclass mAP=0.5738). - AP@any (mAP@any) – AP under any-overlap matching: a detection counts as a hit if it touches its groundtruth box at all. Localisation quality is not judged, which separates “did we find the animal” from “did we box it tightly” – the useful split for a detector feeding a refiner or a fusion. Reported alongside AP@50/AP@75/AP@[.5:.95] in the summary, the per-class table and the metrics JSON (
ap_any). - Max F1 – The best F1 score achievable at any threshold, where F1 = 2 * precision * recall / (precision + recall).
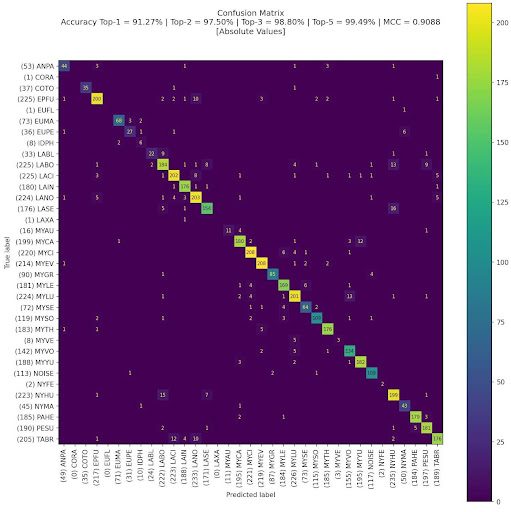
Confusion Matrix: Shows how ground truth categories (rows) are classified by the detector (columns). Values on the diagonal represent correct classifications. Off-diagonal values show misclassifications between categories. The matrix header reports:
- Top-1 Accuracy – Fraction of samples where the top predicted class matches the ground truth.
- Top-2, Top-3, Top-5 Accuracy – Fraction where the correct class is among the top N predictions.
- MCC (Matthews Correlation Coefficient) – A balanced measure of classification quality that accounts for class imbalance, ranging from -1 (total disagreement) to +1 (perfect prediction).
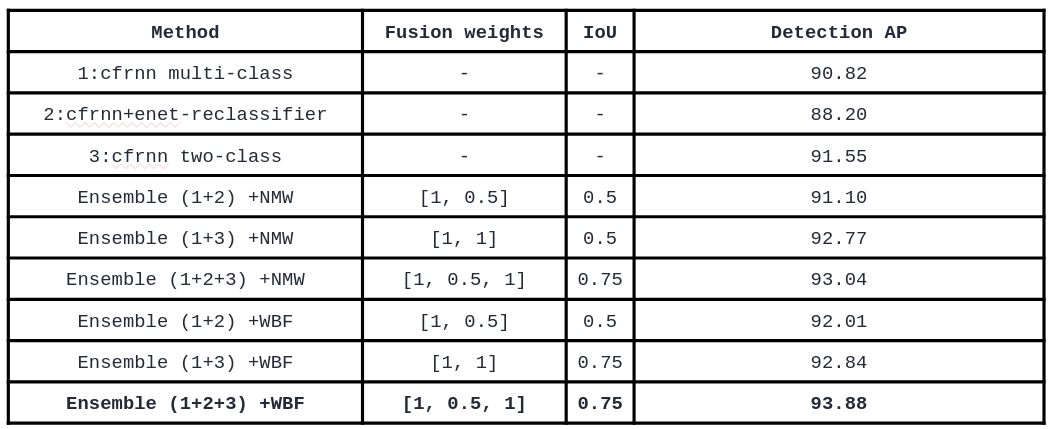
Metrics Table: --output-metrics writes every metric as JSON, and --output-summary writes the printed table. With --per-class the table reports TP, FP, FN, precision, recall, F1 and average precision for each category, alongside the aggregate.
Plots are written to the folder given by --output-plots; the same curves and matrix are also written as CSV by --output-pr-csv, --output-roc-csv and --output-conf-csv.
All-in-One Detection, Track, ROC, and HOTA Metrics
Scripts:
detection_and_track_metrics_across_all– All categories scored jointly.detection_and_track_metrics_per_category– Each category also scored separately.
These scripts call the viame score tool, which computes every metric family below in a single pass over the data, with no external scoring dependencies. It reads the same VIAME CSV inputs as the other scripts.
Detection metrics: True and false positives, false negatives, precision, recall, F1, MCC, and Average Precision (AP, AP@50, AP@75, and COCO-style AP@[0.50:0.95]). All AP values match detections to ground truth in descending confidence order and integrate the precision-recall curve with all-point interpolation.
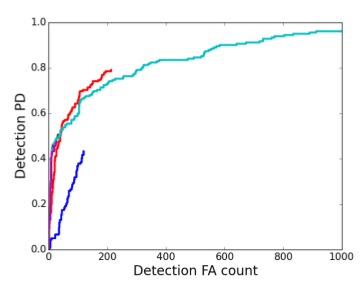
Detection ROC curve: Plots Probability of Detection (Pd) on the Y-axis against false alarms per frame on the X-axis as the confidence threshold is swept from high to low. Note this is a detection ROC, not a classification one: object detection has no enumerable set of true negatives, so there is no false positive rate, and the X-axis is unbounded. The annotated Mean Pd is the area under the curve normalized by the false alarm range it covers, so it lies in [0, 1].
Tracking metrics: MOTA, MOTP, IDF1, ID precision and recall, ID switches, fragmentations, and mostly-tracked / partially-tracked / mostly-lost counts; HOTA with its DetA, AssA and LocA components; and KWANT-style track and target continuity and purity, track Pd, and track false alarm rate. Note MOTP here is the mean IoU of matched boxes (higher is better), where MOTChallenge reports the mean 1 - IoU distance.
Outputs: A metric summary (--output-summary), all metrics as JSON (--output-metrics), and a plot directory (--output-plots) containing the precision-recall curve, the detection ROC curve, the confusion matrix, IoU and track-quality histograms, and the CSV data behind each plot. Individual CSVs can also be written with --output-pr-csv, --output-roc-csv, and --output-conf-csv.
Options:
--iou(default: 0.5) – IoU threshold for matching detections to ground truth.--conf(default: 0.0) – Minimum confidence threshold for computed detections. Ground truth is never confidence filtered.--per-class– Additionally report TP, FP, FN, precision, recall, F1 and AP for every category, plus their mean AP.--no-tracking– Skip the tracking metrics and report detection metrics only.
Both --computed and --truth accept either a single file or a folder. When given folders, files are paired by name and each pair is scored as its own sequence, so frame and track IDs are never matched across sequences.
MOT - MOTA, IDF1, and other High-Level Track Statistics
Scripts:
track_mot_stats_across_all– All categories scored jointly.track_mot_stats_per_category– Each category scored independently, with optional confidence threshold sweep and DIVE filter file generation.
These scripts report the standard Multiple Object Tracking (MOT) benchmark metrics, computed in C++ by viame score. They evaluate how well computed tracks match ground truth tracks over time, considering both detection quality and identity consistency. The metrics are produced in the same pass as the detection metrics, so scoring once yields both.
Core MOT Metrics:
- IDF1 (ID F1 Score) – The primary identity-aware metric. Measures how well computed track IDs are associated with ground truth IDs over the full sequence. Computed as the harmonic mean of ID Precision (IDP) and ID Recall (IDR). Higher is better; 1.0 = perfect identity association.
- MOTA (Multiple Object Tracking Accuracy) – Measures overall tracking quality accounting for false negatives, false positives, and identity switches: MOTA = 1 - (FN + FP + ID_switches) / total_GT_detections. Can be negative if errors exceed ground truth count. Higher is better.
- MOTP (Multiple Object Tracking Precision) – Average IoU overlap between matched computed and ground truth detections. Measures localization quality independent of detection/association quality. Higher is better; 1.0 = perfect bounding box overlap.
Identity Metrics:
- IDP (ID Precision) – Fraction of computed detections correctly assigned to their matched ground truth identity.
- IDR (ID Recall) – Fraction of ground truth detections correctly covered by their matched computed identity.
Detection Counts:
- Recall – TP / (TP + FN), fraction of ground truth detections matched.
- Precision – TP / (TP + FP), fraction of computed detections that are correct.
- num_false_positives – Total count of computed detections with no matching ground truth.
- num_misses – Total count of ground truth detections with no matching computed detection (false negatives).
Track Quality Categories:
- mostly_tracked – Ground truth tracks where >= 80% of their lifespan is covered by a computed track.
- partially_tracked – Ground truth tracks covered 20-80% of their lifespan.
- mostly_lost – Ground truth tracks covered \< 20% of their lifespan.
- num_unique_objects – Total number of ground truth track IDs.
Track Consistency Metrics:
- num_switches – Number of identity switch events, where a computed track changes which ground truth object it is following.
- num_fragmentations – Number of times a ground truth track’s coverage is interrupted (tracking gaps).
- num_transfer – Number of times a computed track transfers to a different ground truth object.
- num_ascend – Number of times a computed track takes over tracking from another computed track.
- num_migrate – Number of times a ground truth object is handed off between different computed tracks.
Threshold Sweeping and DIVE Filter Generation:
When the per-category script is run, it uses --sweep-thresholds to test many confidence thresholds and find the optimal value for each class. The script reports the threshold that maximizes IDF1 and the threshold that maximizes MOTA for each class. With -filter-estimator avg_minus_1p, it also generates a dive.config.json file containing per-class confidence thresholds that can be loaded directly into the DIVE interface to filter detections at optimal levels.
The summary is written by --output-summary and the full metric set by --output-metrics.
KWANT-Style Track and Detection-Level Properties
These properties were historically produced by the external KWANT score_tracks tool, which required inputs in the Kitware kw18 format. They are now computed directly from VIAME CSV by viame score (see the all-in-one section above), and are reported in its summary under “KWANT-style Metrics” and “Track Quality”.
Metrics:
- Track Pd (Probability of Detection) – Fraction of ground truth tracks matched at least once by a computed track.
- Track FA (False Alarm rate) – Fraction of computed tracks that never matched any ground truth.
- Track continuity – One divided by the number of unbroken segments in a computed track, averaged over tracks. A value of 1.0 means no tracking gaps.
- Track purity – Average fraction of each computed track dominated by a single ground truth object (0-1). A purity of 1.0 means each computed track follows exactly one ground truth object without identity confusion.
- Target continuity – The same continuity measure applied to ground truth tracks.
- Target purity – Average fraction of each ground truth object’s coverage dominated by a single computed track.
- Track completeness – Average fraction of each ground truth track’s lifespan covered by its best matching computed track.
- Avg gap length – Average length, in frames, of the gaps inside fragmented tracks.
Distributions of track purity and continuity are also written to the plot directory as histograms.
DIVE Documentation
DIVE scoring compares computed annotations against ground truth from within the interface. On web, keep truth and model output in separate DIVE annotation sets (for example groundTruth versus default) and score them from the Scoring tab.
Code and Build Flags
Command line tools:
- tools/score.cxx –
viame score
Source code:
- plugins/core/evaluate_models.cxx
- plugins/core/evaluate_models.h